In this post I’ll explain the basics on using a SIEM: how to search logs and how to send alerts.
This is the third post of the series “SIEM 101” where I explain the basics of a SIEM, from installation to simple usage. You can see the previous post SIEM 101 — Initial setup.
Now that we receive our logs in our Logz.io account, it’s time to learn how we can navigate the logs, how they are organized and how to search for specific patterns. Once we know how to search patterns, we’ll be able to start creating alerts on specific pattern, like SSH bruteforce or Windows bruteforce.
The technology used by this SIEM
Let’s start with the technology. Logz.io is based on Elasticsearch as a database and uses Kibana to interact and visualize the data in the database. They added some custom features around these two tools to provide alerting and other things.
Elasticsearch – an ideal SIEM database
Elasticsearch is a “NoSQL” database that stores, indexes and provides analytics tools for JSON formatted data. The official description is:
Elasticsearch is a distributed, open source search and analytics engine for all types of data, including textual, numerical, geospatial, structured, and unstructured. Elasticsearch is built on Apache Lucene and was first released in 2010 by Elasticsearch N.V. (now known as Elastic). Known for its simple REST APIs, distributed nature, speed, and scalability, Elasticsearch is the central component of the Elastic Stack, a set of open source tools for data ingestion, enrichment, storage, analysis, and visualization. Commonly referred to as the ELK Stack (after Elasticsearch, Logstash, and Kibana), the Elastic Stack now includes a rich collection of lightweight shipping agents known as Beats for sending data to Elasticsearch.
Kibana – a basic SIEM interface
Kibana is a web-based user interface to visualize the data stored in Elasticsearch. It was designed by the same team that developed Elasticsearch and built specifically to interact with it’s data. The official description is:
Kibana is an open source frontend application that sits on top of the Elastic Stack, providing search and data visualization capabilities for data indexed in Elasticsearch. Commonly known as the charting tool for the Elastic Stack (previously referred to as the ELK Stack after Elasticsearch, Logstash, and Kibana), Kibana also acts as the user interface for monitoring, managing, and securing an Elastic Stack cluster — as well as the centralized hub for built-in solutions developed on the Elastic Stack. Developed in 2013 from within the Elasticsearch community, Kibana has grown to become the window into the Elastic Stack itself, offering a portal for users and companies.
Source: https://www.elastic.co/fr/kibana
The interface
For the next steps, login in your Logz.io account and head over to Kibana:
As you can see, there are a lot of information available in a compact manner.
The top section, like in the picture below, allows to navigate in the available Logz.io features / sections
We’ll talk about each of them in details when the time comes, but in a few words:
- Metrics is used to have an easy and centralized view of your server(s) metrics, like CPU usage, memory usage, etc.
- Live Tail is used to look at the logs as they come in the platform, in real-time.
- Send Your Data is where you can get details on how to connect many platforms and technologies to Logz.io.
- Alerts & Events is where we go to create and modify alerts.
- Insights provide useful hints on what problems might be occurring in your server(s).
- ELK Apps is a marketplace of Dashboard, Alerts and other useful tools provided by Logz.io and the community.
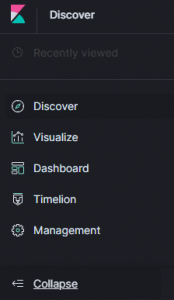
For the left section, you can press the button to the bottom to expand the section:
Once expanded you get the following:
The Discover section is the one you see as you come on the site. It allows to search and browse the data. We’ll have a look later in this post.
The Visualize section is used to generate aggregated graphs (Pie Chart, Data Table, Heat Map, Region Map, Line Graph, etc.). This is really useful to easily make sense of a lot of data. For example, you could search for the most common processes started on a single server or on all your servers. Or you could draw the total traffic logs over time for your website to better understand your peak hours.
The Dashboard is useful to create, you guess it, dashboards. They are a centralization of multiple saved Visualize graphs. They allow to quickly see different pattern that interest us in a centralized place. Also, any filter you apply on the dashboard will be applied to all the Visualization in the dashboard. For example, if you have a dashboard for your website traffic, you can isolate a single IP and see all the Visualization graphs automatically updated to display info on that single IP.
Timelion is useful to overlay and compare different time-based graphs. You could, for example, compare the traffic between 2 servers by having them in a single graph.
The Management section is for, well, management (of Kibana). But this is for advanced users and we don’t have to go there often, so I won’t go in details.
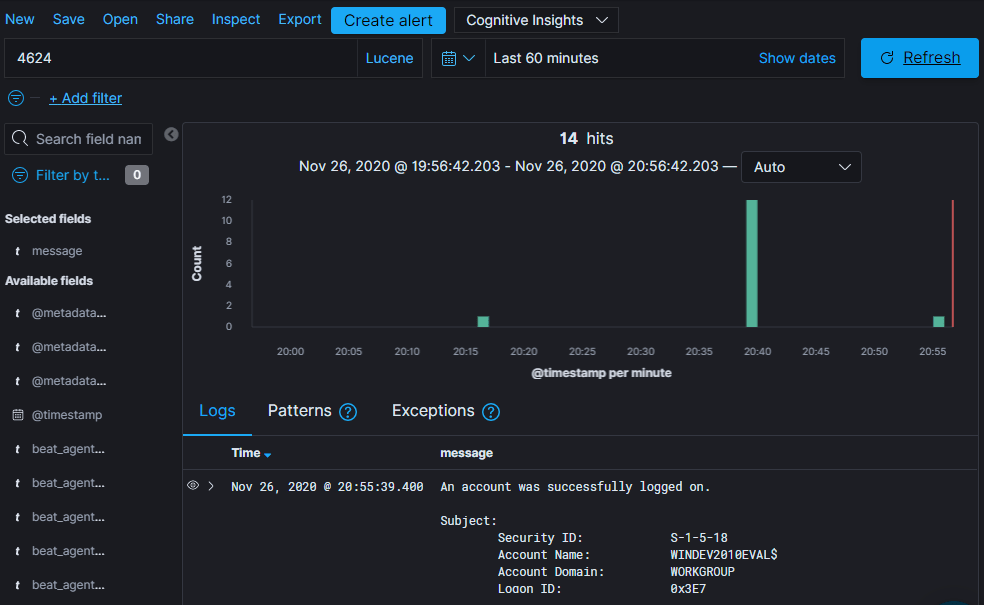
In the top of the center section we have the search tools:
Here we can use a Lucene query or a Kibana Query Language (KQL) query to search for the data. We can also apply filters (for example: “IP: 127.0.0.1”).
On the right we have the time period over which we apply our search (in the picture here the data displayed is from the 15 minutes before the moment the search was launched).
To refresh the data, we can press the “Refresh” button. It is possible to Save a search so they can be Opened at another time, or Shared.
The big “Create alert” button is useful to quickly jump to the section to create an alert from the currently applied query and filters. This is what we’ll be using later to create an alert.
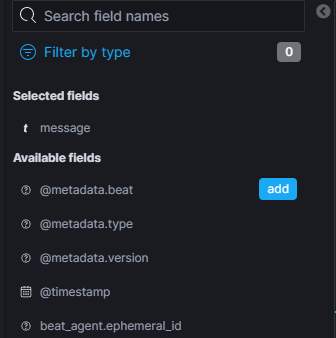
In the left of the center section we have all the fields available from our logs. We can interact with these fields (filter, visualize, etc.):
The Selected fields are the one used as columns in the main center section. When you hover on a field, the “add” button appears. You can add columns to the main center section by clicking on the “add” button. You can also click a field to get a quick view of the top values for that field.
Note: If you get the button “Field not indexed”, simply click on it. The page will refresh and the field will be available.
In the center of the center section we have the main section:
At the top of the main section we have a timeline for the count of messages over a period or time.
In my picture, we can see I have around 3 messages per period of 20 seconds, for a total of 68 messages (hits). You can use your mouse to select a time period and change your time frame (here being the “Last 15 minutes”).
Note: in my blog, “messages” and “logs” are interchangeable and are used to describe a single event that happened on the server or computer, like a logon.
Then we have the logs. This is where all the magic happens:
Here I only have 2 columns selected: Time and message. If you where to add more fields as column, they would be visible here.
When you hover on a field (like “message”) you get an X to remove the field from the displayed columns.
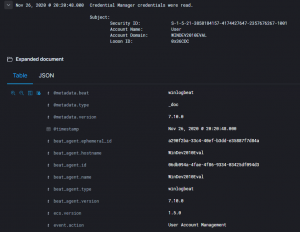
If you click on the small arrow to the left of the row, you can expand the specific log to see all the fields and their values:
Here, on the left is the name of the field, like “@metadata.beat” and on the right is the value, like “winlogbeat”. If you hover on the field, you get 4 icons:
The + and – are used to add a filter to specifically search for the value or to remove the value from the results, respectively. The next icon to the right is used to add the field as a column and the last one is to add a filter to make sure the field is present in the log (for example, exclude the logs that don’t have an IP).
Navigating the logs in a SIEM
To learn how to navigate the logs, we’ll use a useful context in windows environment: we’ll search for the last user that logged in.
A quick google for “windows view the logon events” give me many results, including https://docs.microsoft.com/en-us/windows/security/threat-protection/auditing/basic-audit-logon-events.
By reading we can understand that Windows logs the logon events. By scrolling a little, we can see the “Logon events” number and their matching description. Here “4624” looks like what we are looking for: “A user successfully logged on to a computer.”.
Hint: learn the event IDs 4624 and 4625, they are used really often in a Windows environment!
So back in Logz, we need to find the field that contains the 4624. What happens if I search for “4624”?
No results… Hum… Ohhh the time frame! I didn’t login in the last 15 minutes. Let’s change that to 60 minutes ago and click the Update button.
14 hits! But wait, I didn’t login 14 times in the last hour? And what are these users with a dollar “$” sign I can see in the “message” column? Let’s ask Google. A search for “windows event id 4624 user with dollar sign”, first result: https://www.ultimatewindowssecurity.com/securitylog/book/page.aspx?spid=chapter5
Hint: you can save this site for later, ultimatewindowssecurity.com is filled with info on Windows event details, including Sysmon!
This page has a lot of info. Let’s jump to the explanation of the “$” sign with CTRL+F (search in page). We get this description:
DC Security logs contain many Logon/Logoff events that are generated by computer accounts as opposed to user accounts. As with computer-generated account logon events, you can recognize these logon and logoff events because the Account Name field in the New Logon section will list a computer name followed by a dollar sign ($). You can ignore computer-generated Logon/Logoff events.
So the events with these accounts are computer-generated Logon events. But they happen on a Domain Controller (DC). In my case, I am testing on a Windows instance not joined to a domain so this is not what I am looking for.
Let’s keep digging. The name of the field was “winlog.event_data.SubjectUserName”, I wonder if another field contains “UserName”. Looks like it: “winlog.event_data.TargetUserName”.
Hint: When DC joined, when you have more than one DC sending logs, you’ll get more than one user. You can enter the following query to filter our all the users with a dollar sign: “winlog.event_data.SubjectUserName: /.?\$.?/” (without the quotes), the total query at this point being: “4624 AND NOT winlog.event_data.SubjectUserName: /.?\$.?/” (without the quotes)
For simplicity, I’ll add the field “winlog.event_data.TargetUserName” as a column:
There you go, I now have useful details!
So it looks like my most recent logon was on “Nov 26, 2020 @ 21:13:04.405”.
Note: You might have noticed that the logs timestamp change from picture to picture, this is because as I write this post I update and refine my search so I can get useful images.
Creating an Alert – the best feature of a SIEM
Now we know how to search the logs, the only thing left is to create an alert and send an email. I’ll use the same context and create an Alert to email me every time I logon.
Note: this is used as an example only. If you create an alert like this, you’ll receive a lot of emails!
So, starting from my research for the most recent logon for my user named “User” (I know, it’s original!), I’ll add a filter specifically for my user so I don’t receive an email every time my computer generates an event:
We are now filtering specifically for the user “User”, but I don’t like the “4624” in the search bar, without specifying it’s field name; it’s comparing the value to all the values of all the fields! Now that we know we only have the real logon events for my user, let’s find the field name for the event ID 4624 with a CTRL+F “4624”:
Note: don’t forget to open a log so we can see all it’s field
Note: Kibana display the thousands with a comma so we need to search for “4,624”… I am Canadian, I hate this format
Let’s filter for the value “4624” for the field “event.code” and remove the “4624” from the search bar and click the “Update” button:
Hint: For performance reasons, it’s better to use filters than the search bar, but that only work for exact matches.
Now that we have exactly the results we want, we know our query is good. Let’s click the big blue “Create alert” button. We are redirected to the “Alerts & Events” section of Logz.io.
We give the alert a name: “The user User logged on”
Leave everything as is, up to the section “Notify” (the query in the section “Search for…” is pre-filled with the filters we prepared before, thanks to the big blue button).
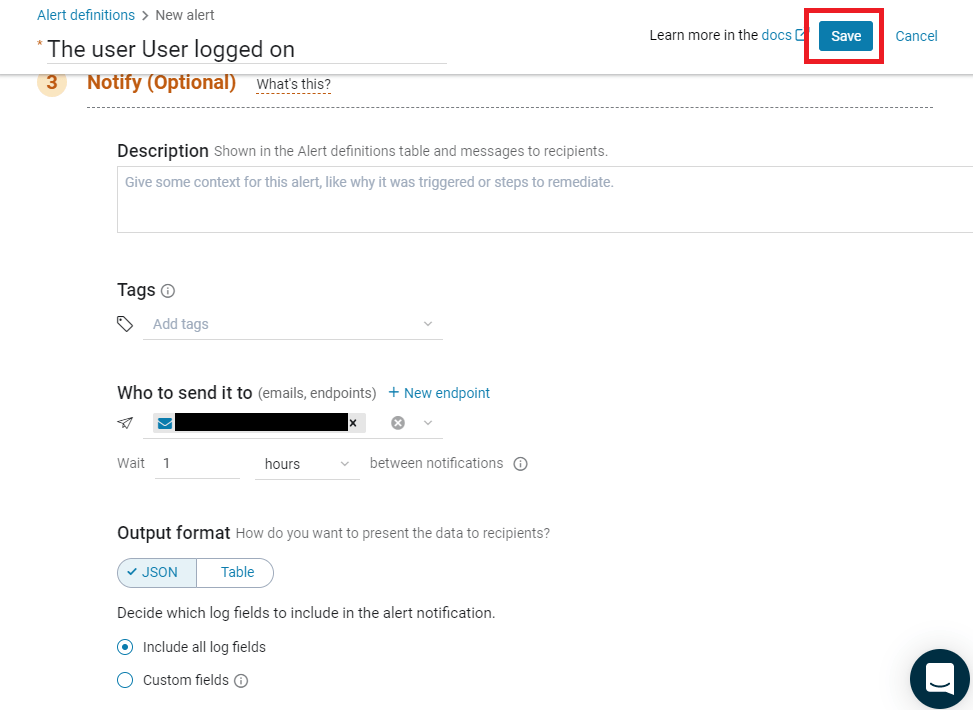
You can give a useful description if you want, I don’t as my alert title is clear enough.
Then in the field “Who to send it to”, simply write your email and select it.
When you’re satisfied with everything, click the “Save” button on the top right:
The only thing left is to test the alert. Simply login on your computer and you should receive an email in the next 15 minutes (that’s the time I defined in the “Trigger if…” section). You will now receive an alert every time you login on your computer!
Note: If you add more computers, because we didn’t filter for the source, you would get an alert every time the user “User” logon on any computer.
Conclusion
That’s it! You now know the basics of Logz.io, how to search logs and how to create alerts, which is the basis of using a SIEM. I will leave to you the pleasure of discovering how to create Visualize graphs and Dashboards. There are a lot more things to learn, which we’ll do in time. Everything is now in place for me to start writing blogs on detection patterns! I’ll do simple patterns in the “SIEM 102” series, and more complex detection patterns in the “SIEM 201” series. I’ll eventually talk about how we can automate responses and transform and bonify the data.
This post was originaly published on https://www.tristandostaler.com/siem-101-basic-usage/ on 2020-11-26T11:13:21.


